Automating performance issue discovery in our Dev cycle

In this article, we will explore the need for a comprehensive approach to finding performance problems in our code, acknowledging that, while valuable, static analysis is not the sole answer. There are other approaches and tools that we can take to ensure that we are not missing any performance issues.
Table of Contents
What is Static Analysis?
Before we get into the limitations, let’s understand static analysis. It’s an automated process that analyzes code without executing it, helping us identify potential vulnerabilities and enhance the code’s quality.
Static Analysis helps identify potential issues early in the development process, saving time and resources during testing and maintenance.
Popular Static Analysis tools
Developers can choose from various static analysis tools and services based on factors such as programming language support, tool integration, and project requirements.
SonarQube is an open-source platform that offers continuous code quality inspection for multiple programming languages, identifying bugs, vulnerabilities, and code issues. In addition to SonarQube, other static analysis tools, such as Coverity, Checkmarx, or Snyk, are available.

Static Analysis Tools
How does static analysis help us improve performance?
Since static analysis is a passive process and does not execute code, it can not help us much to improve the performance of our code. In fact, static analysis can help improve performance in several ways:
- Identifying Inefficiencies: Static analysis can find inefficient algorithms and data structures, by providing better alternatives, we can improve performance.
- Resource Leaks: We can reduce the amount of resources needed and improve the system’s performance by optimizing resource allocation, such as memory or network connections.
- Concurrency problems: One important aspect that we can address using static analysis is concurrency issues. Static analysis can identify concurrency issues such as race conditions or deadlocks.
- Code optimization: Static analysis can find unnecessary computation, redundant code, or other optimizations that can be done in the code. It offers refactorings that ultimately lead to better performance.
Why is static analysis alone not enough to find all performance issues?
As you know by now,
Static analysis provides valuable information for improving the quality of the code, but it is not a complete solution for finding all performance issues.
This is a misconception if we think that static analysis can find all performance problems of our system.
There are some reasons that static analysis cannot detect all performance issues:
- Runtime Behavior: As mentioned earlier, Static Analysis only examines the source code without executing it, so it can’t examine an application’s dynamic behavior at runtime. Some performance issues, like memory leaks and race conditions, might not be detectable through static code analysis and could require running the application.
- Contextual Information: Some performance issues occur with specific input data or are dependent on the context in which the application is running. Therefore, Static Analysis tools are not good options for detecting these issues.
- Dependencies: Because static analysis is static, it cannot detect dependencies between modules in an application or interactions between different components. Therefore, factors like network latency, database queries, or third-party API calls can significantly affect performance but might not be identifiable during static analysis.
Other approaches to finding performance problems (Dynamic Analysis)
Now is the time to introduce other approaches to diagnosing performance issues in programs so that we can address the weakness of static analysis.
As we can guess from the above, all other approaches are related to Dynamic Analysis techniques. These approaches evaluate an application’s performance and behavior during runtime.
Dynamic Analysis differs from Static Analysis in that it executes the application and observes its performance to identify issues or inefficiencies, whereas static analysis reviews the source code without running the program.
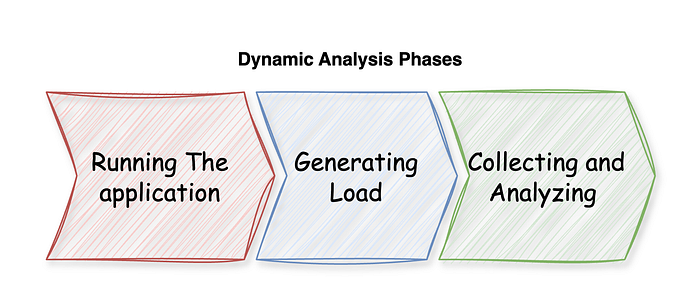
In general, we can split a Dynamic Analysis approach into three main phases:

Dynamic Analysis Phases
1- Running the application in a way that it can be observed and monitor
The main difference between a static and dynamic analysis is the fact that dynamic analysis executes the application, but to be able to collect data about the running application, there are several ways depending on the operating system, platform, framework, and programming language used:
- Code Instrumentation: Code Instrumentation can happen at the library or platform level. By adding some instructions to the application while it is running, it is possible to monitor the application in runtime by analyzing metrics or logs sent by the application.
- Metrics and logs: Metrics and logs can be collected automatically at the library level or programmatically in the application code.
- Profiling: Profilers may use different methods to control the execution of applications based on the programming language, operating system, or execution environment.
2- Generating load for the running application
Now that the application is up and running and we can observe it, it is time to start generating load to gather data for analysis. Load generation can be done manually by the developer, tester, or end user in different environments or automatically by any dynamic testing technique such as load testing, stress testing, or performance testing.
3- Collecting and analyzing data
Now everything is prepared. At this phase, Dynamic Analysis tools measure various aspects of an application’s performance and track application behaviors, such as execution time, memory usage, and resource utilization during execution. Some of these tools can provide real-time insights into the application, and some others use AI for more smart insights. Through analyzing the gathered data, we can pinpoint bottlenecks and identify opportunities for optimization.
Different kinds of Dynamic Analysis tools
There are many tools for performing Dynamic Analysis, but not all of them support all the above-mentioned phases. The ideal scenario is to use a mix of them to achieve the best results. We can categorize them into two main groups, but it is not a restricted categorization:
APM (Application Performance Monitoring) Tools
APMs such as New Relic, Datadog, Splunk, or Dynatrace provide features such as Resource Utilization Monitoring, Error Tracking, Real-time Alerting, and more, giving us visibility into the application’s behavior at runtime, so they are very helpful for identifying performance problems and optimizing our applications.
The main downside for APMs in finding performance issues is in the second phase, they can normally find the problem when the application is in production and users are using it, which might be a bit late! We usually overcome this shortcoming by mixing APMs with other Dynamic Testing tools and starting load and performance testing early in the application development cycle before going to production.
Observability Tools
Observability tools encompass a broader context than APMs, including the entire system’s behavior, especially when it comes to distributed systems and their component interactions. Some of the APMs that I mentioned in the previous section are also Observability Tools, such as New Relic, Datadog, or Splunk, and some others, like Grafana or ELK. Although observability tools can help us identify a broader range of performance issues, problems similar to APMs remain.
Profiling Tools
Profiling tools such as JProfiler, YourKit, or Visual Studio Profiler can identify performance issues in applications but in different ways, with different focuses, approaches, and use cases. Unlike APMs and Observability tools, Profiling tools are typically used during development and testing phases to identify bottlenecks and optimize code performance by identifying resource usage and execution time of individual components, functions, or lines of code.
Profiling tools analyze the performance of individual components during the development
However, Observability and APM tools offer real-time insights into overall application performance, especially in production environments.
Dynamic Testing Tools
Different dynamic testing tools, such as those applicable for load testing, stress testing, or performance testing, can assist in identifying issues under various conditions and workloads. These tools are usually great in phase 2 or maybe 3, but since they consider the application as a whole and use black-box testing approaches, the range of performance issues they can detect is limited. However, they work very well in covering phase 2 in the mix with other tools.
How Digma Identifies Performance Problems: A complete Dynamic Analysis stack
Digma provides a complete Dynamic Analysis stack for us to execute our application, collect observability data, and identify performance problems such as bottlenecks, scaling problems, and db query issues.
Digma vs. Observability and APM tools
Observability and APM tools are great at identifying and alerting us when a performance issue has already occurred in production but it might be late. Digma continuously observes our application in development (Using the Digma IntelliJ plugin), testing, and production to find performance issues in our code so we can identify performance issues before they occur in production.

Digma: Continuous Feedback
On the other hand, Digma integrates with our IDE and CI pipeline. When a performance problem is detected, it automatically highlights and prioritizes critical problems and their locations in the code. Unlike Observability and APM tools, we don’t need to spend long hours manually checking for issues, jumping between different tools and dashboards, and tracking down where the problem is in your code. By using Digma, we can immediately see performance issues highlighted in your code, down to the method, class, or even query level.
Final Thought
In this article, we discuss that while Static Analysis is a valuable tool for identifying potential performance problems, it is not sufficient to resolve all of them. Dynamic Analysis techniques, such as monitoring and observing the application during runtime, are essential for uncovering runtime-specific performance problems. By combining both Static and Dynamic Analysis approaches, developers can gain a comprehensive understanding of their code’s performance and ensure the delivery of high-quality, efficient software.
More articles you might find interesting:
- How to call a Spring Bean from a custom Logback appender class
- How to Increase Test Coverage with Tracing


