Collecting important data about your code in dev and test has become trivial, it’s now also getting easier to put that data to use.

Tracing > Debugging
There are many benefits to being able to follow what your Spring Boot code is doing using tracing. When used effectively, traces can reveal a lot about the inner workings of complex systems, or provide early feedback when you make mistakes in introducing new code changes.
Unlike debugging, which basically allows you to pause at a specific moment in time and in a specific code location, traces track how the code works over multiple code locations without needing to stop or focus at a specific juncture. It is by aggregating that data that patterns start to emerge that would be impossible to track with simple breakpoints alone.
The main reason most developers use debugging over tracing is that it is more available, immediate, and does not require any complicated setup. However, technologies such as Micrometer and OpenTelemetry are receiving wider support and deeper integration in existing libraries, changing the parameters of this equation.
How to get to fully observed code with Spring Boot and Micrometer
Thankfully, it’s extremely easy to get started with Micrometer. These capabilities are even easier with Spring Boot 3.2 but are available in Spring 3.x releases. To make it even easier, we’ve invested in a free IDE plugin (IntelliJ only for now, though other IDEs coming soon!) that can reduce the amount of work required to start getting information about your code with tracing — to a few clicks. Digma also runs locally! So there is no issue about sending observability data to the cloud.
I have previously written on the benefits of using Micrometer Tracing in terms of its low-performance impact (definitely compared to the OTEL agent, which is much more suited for dev and test). But how easy it is to get started? Here is a quick guide to getting from no observability to fully observed in just a few steps.
Like all else, start with dev
There are many benefits to using Tracing, even in dev. For once, you can get a feel for the type of feedback and knowledge you can gain by analyzing the code, with minimal changes.
Here is how to get started:
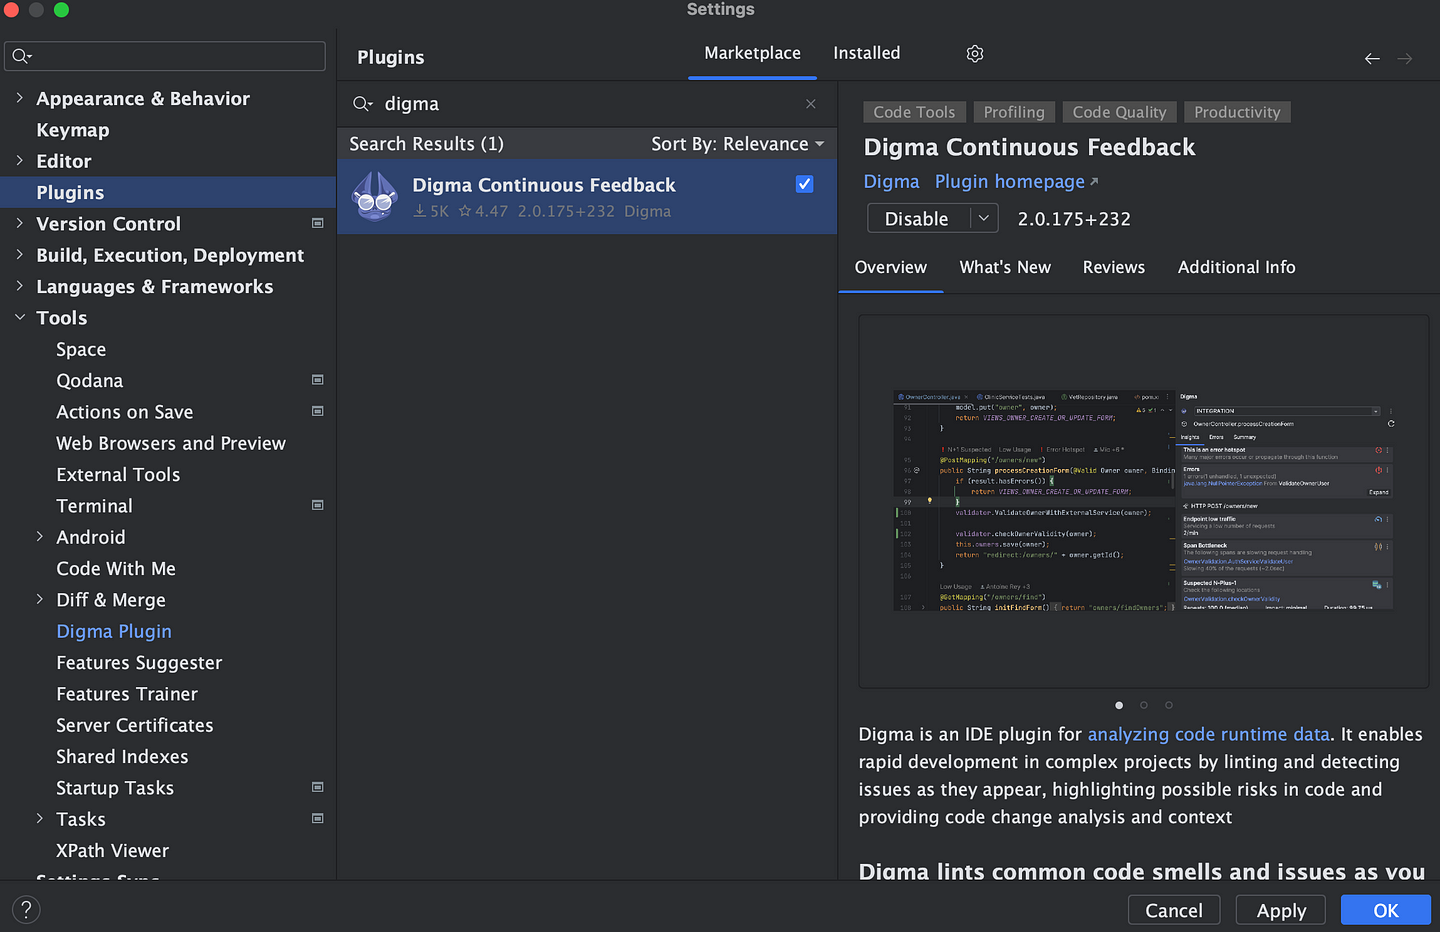
- Install the Digma plugin from the Jetbrains marketplace.
2. Set the instrumentation strategy to ‘Micrometer’ in the Digma Settings (Settings/Preferences->Digma).
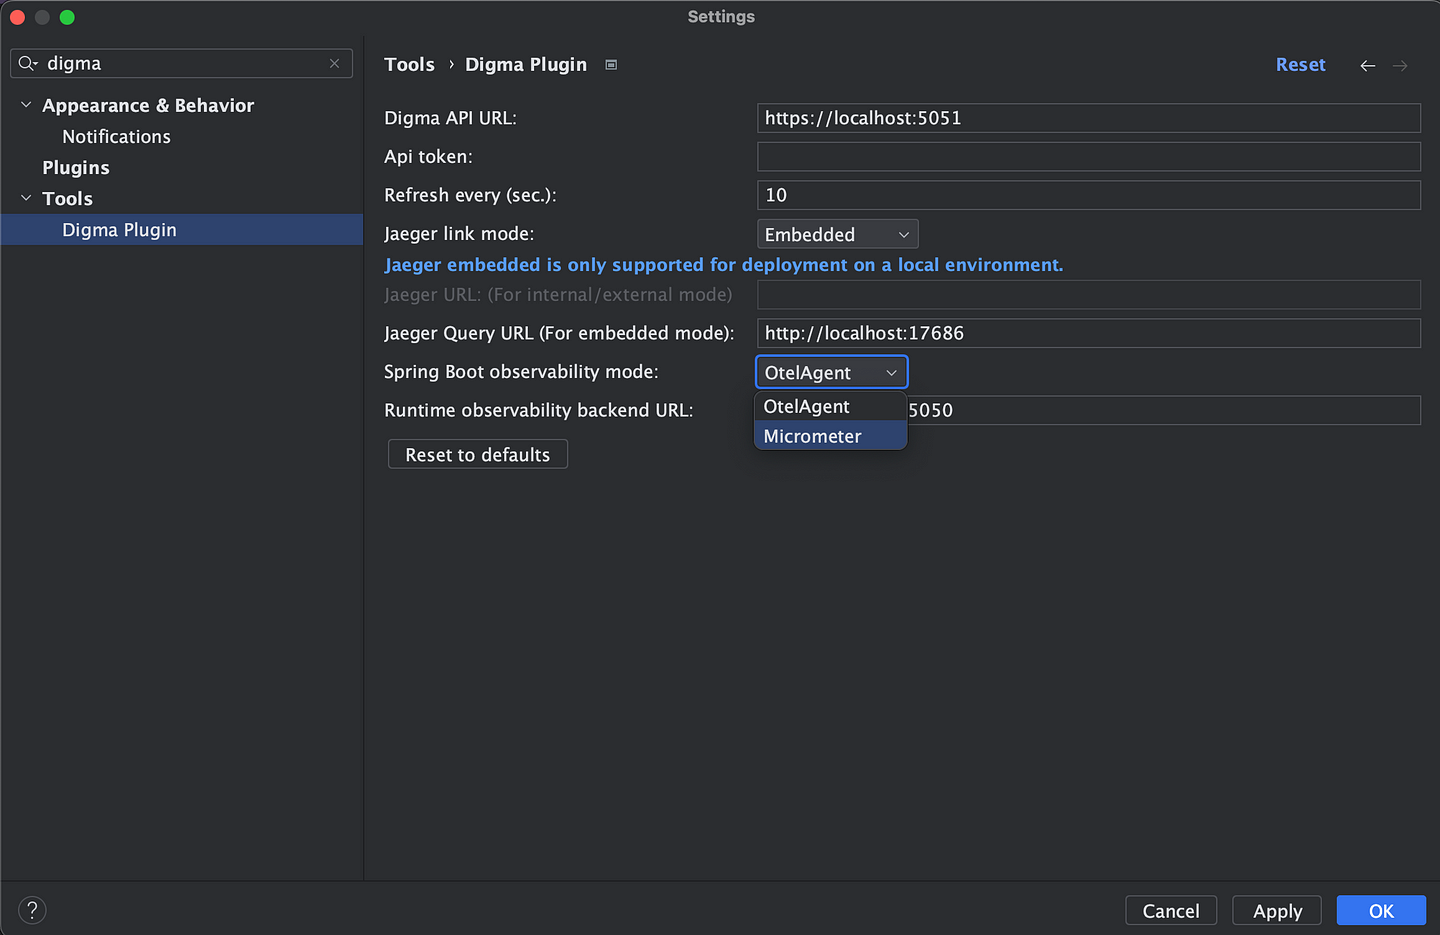
Digma can work either with the OTEL agent (which is downloaded and configured automatically) or with Micrometer Tracing. Both are alternative ways to enable OTEL in your project with Micrometer being more production-ready.
3. A link will appear in the UI a few seconds later, suggesting to apply the required configuration changes to enable tracing. This includes adding some dependencies and system properties. We’ve reduced all of that to a single click.
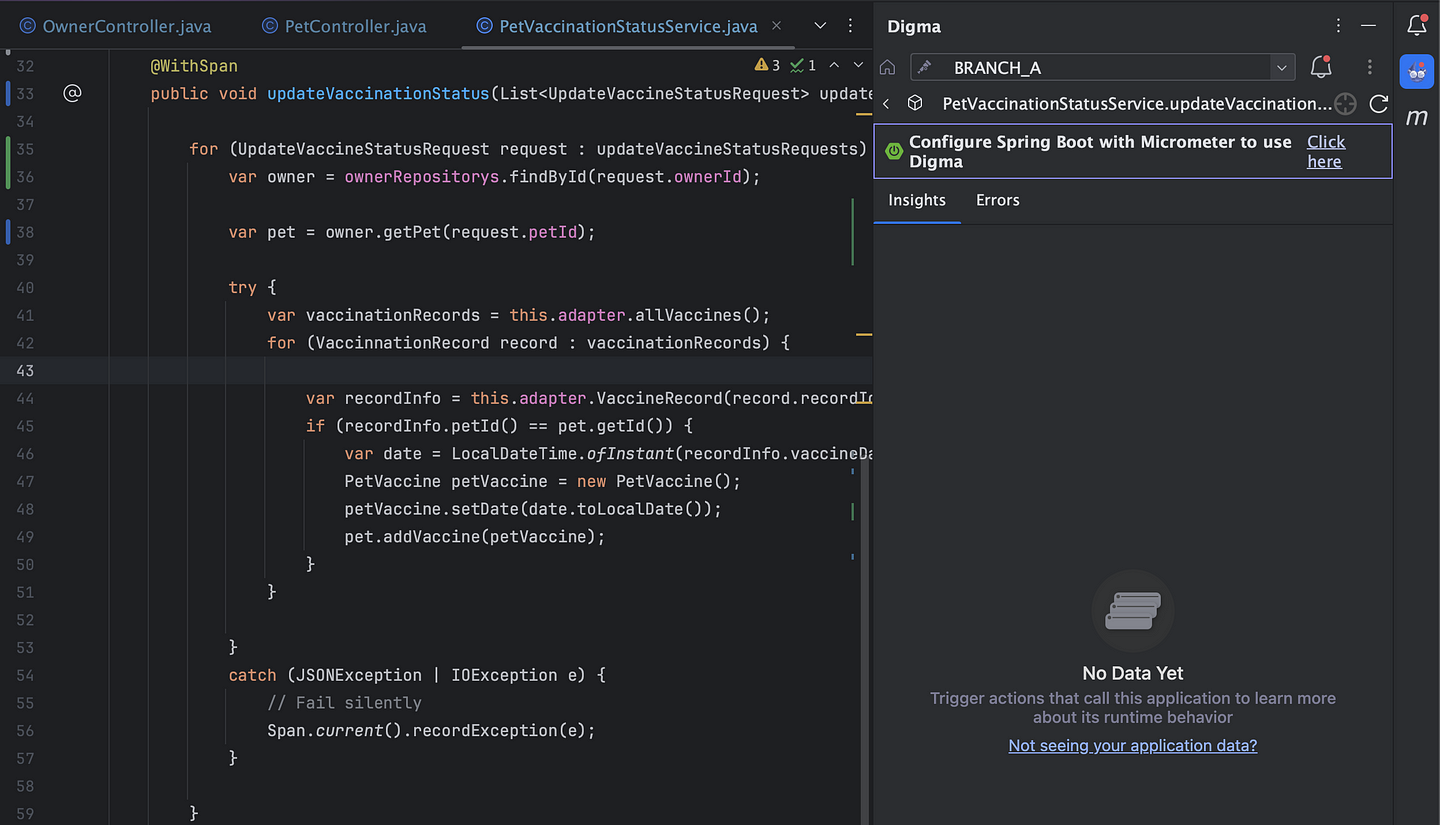
Behind the scenes, the plugin will add the required dependencies to the gradle/pom file.
4. Finally, make sure ‘Observability’ is turned on in the Digma side panel:
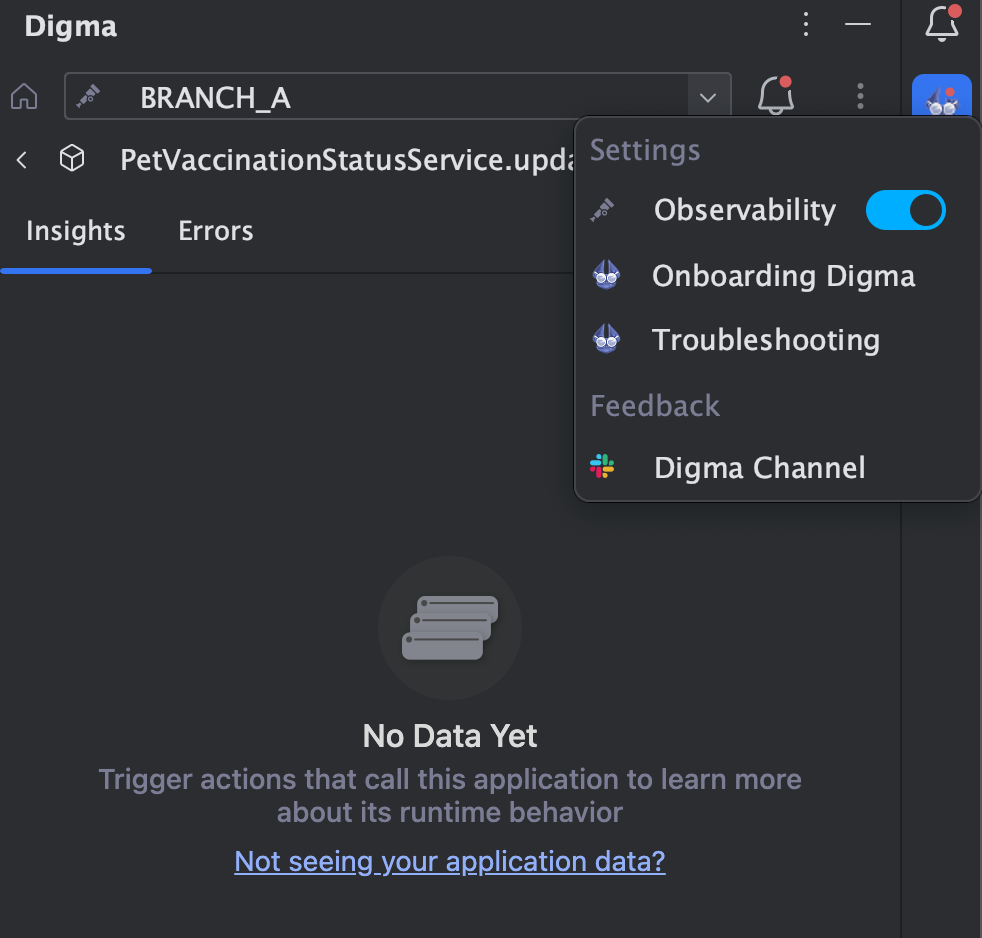
That’s it! All that remains now is to launch your application and run some traffic through it, you should be seeing data appear almost immediately.
What we do with observability matters
It is tempting to look at the ability to quickly navigate from the code to the relevant trace as the holy grail of leveraging tracing and observability while coding. However, if you try to go down that path you’ll soon find that the individual trace is just not that important.
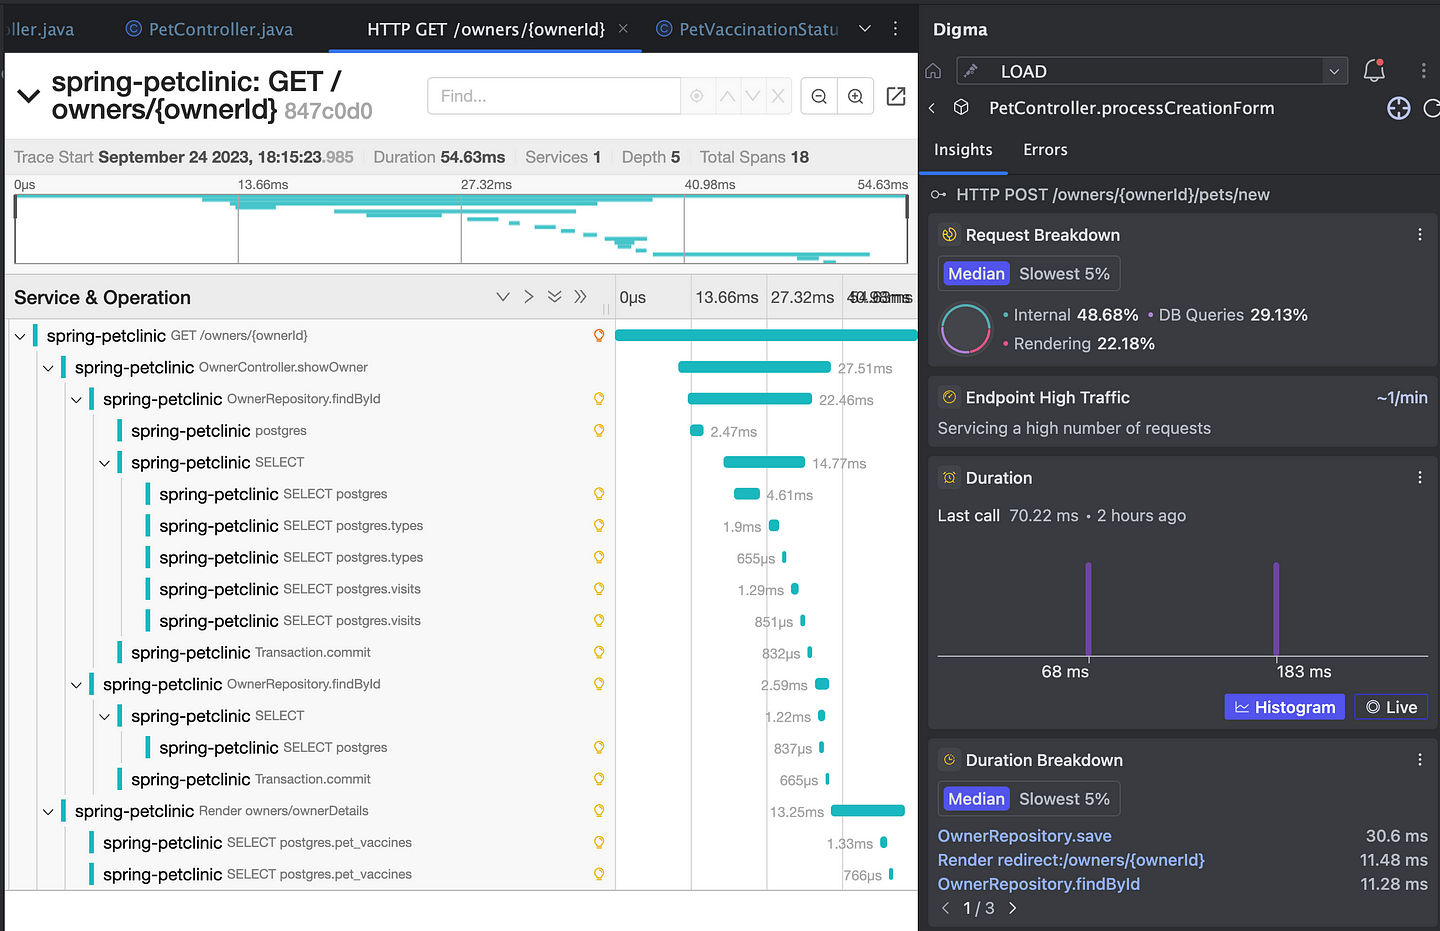
Traces are a great way to understand code behavior and provide a good ‘request handling anatomy’ as a reference or guide for any developer working on a piece of code. However, the granularity level of the individual trace runs a serious risk of spamming and cluttering our view with irrelevant data. More importantly, we may end up missing critical data such as errors, bad performance, or issues with the flow of control simply because that specific chosen trace does not contain them.
Taking that a step further, one can find that the truly important things we need to learn are not even contained in any individual trace. The complete picture can only be understood by analyzing the totality of them — understanding the trendlines, escalating issues, and anomalies. This is especially true for complex or distributed systems but manifests itself also in simple applications with enough traffic.
Continuous Feedback is a new development practice that uses observability sources such as tracing to keep developers proactively aware of what their code is doing. The key premise is that all of the information is already there, it is the processing of it that requires too much effort to include in everyday coding.
What we’re trying to do with digma.ai is just that, create a platform that takes tracing beyond anecdotal data points into knowledge you need to have as you work on code. You’ll be able to see that as you work with Digma
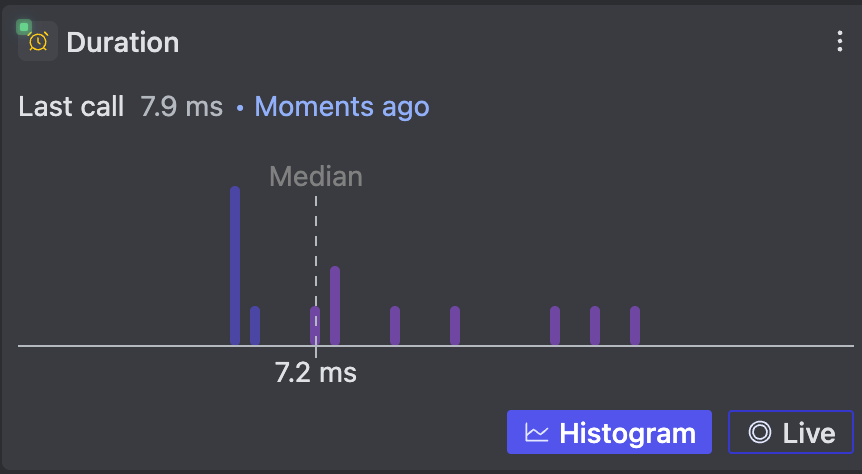
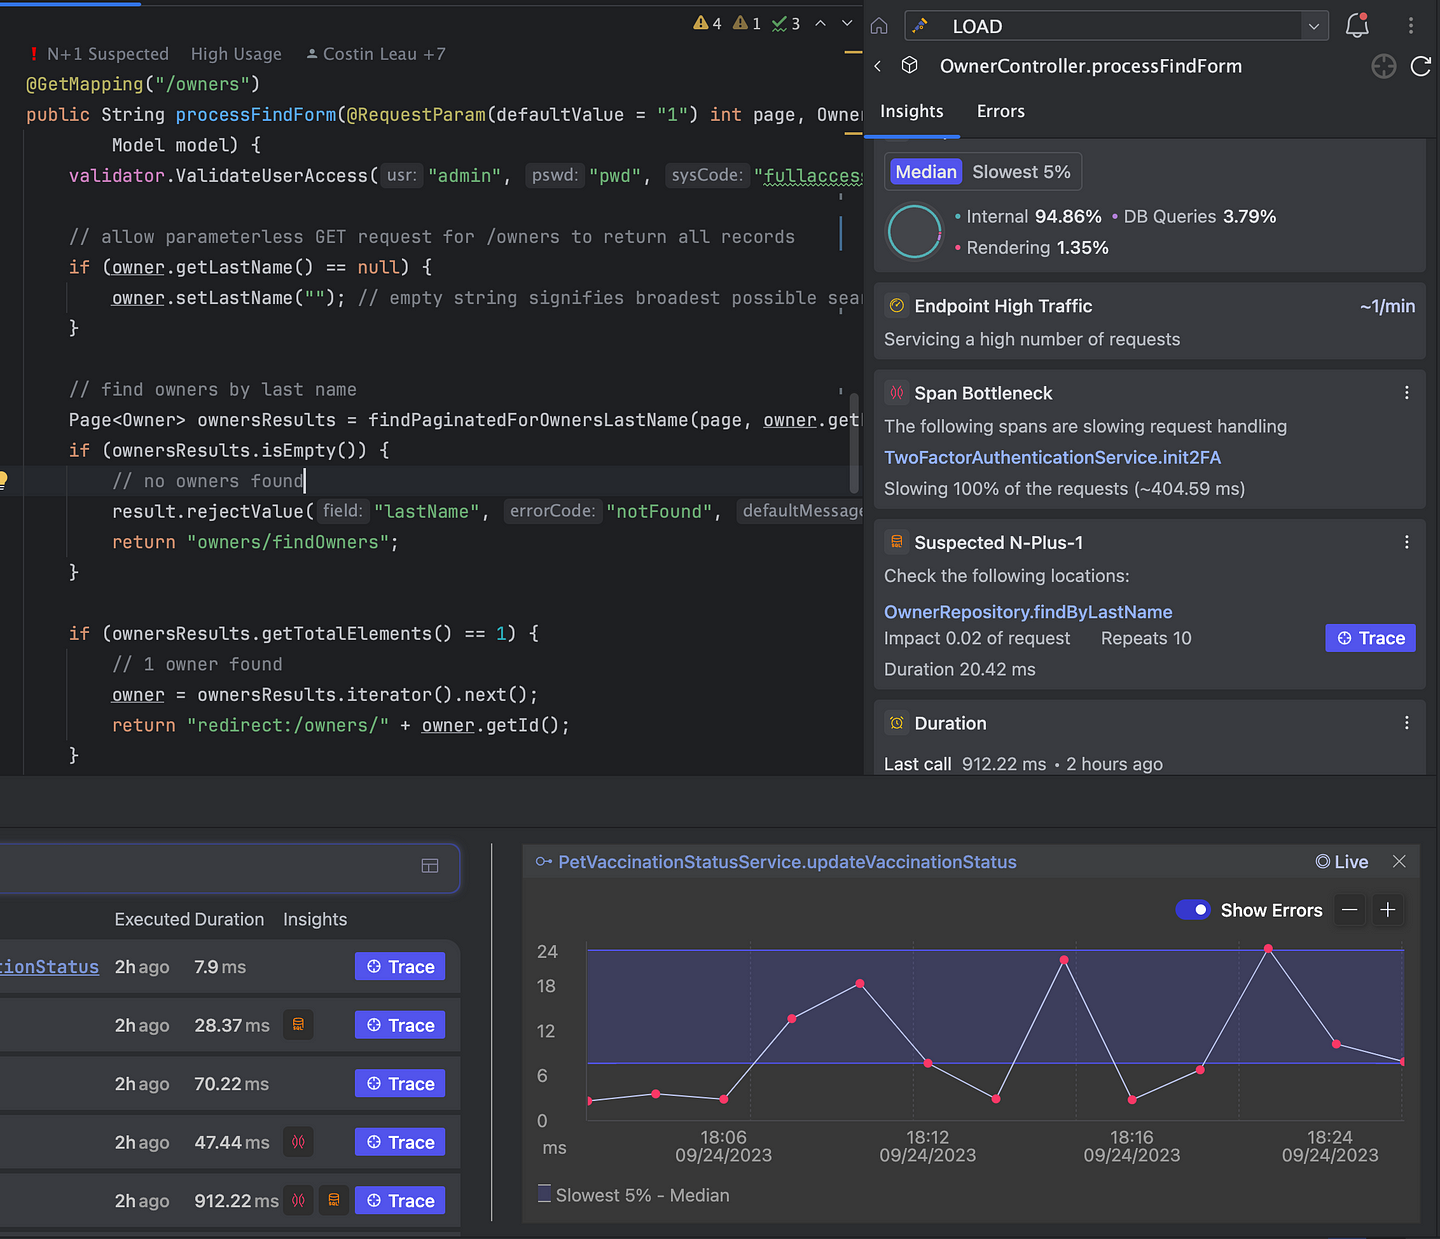
In that vein, we’ve reversed the pyramid so to speak — instead of sifting through logs and traces to find issues — Digma analyzes that data to find issues and then allows you to navigate to the relevant logs and traces that represent good examples.
In this sense, the first and most important priority is to actually find these important aspects related to our code we would like to know and understand, and only then to drill down into the lower-level graphs, traces, and metrics. We can ask questions such as ‘What does an average request look like’ vs. ‘What does it look like when it’s slow’ and save a lot of time by letting the toolings discern the root causes for us.
Adding more observability
Beyond automated instrumentation available for Spring Boot, JDBC, and other libraries, you may want to inspect the behavior of specific functions in your code. Micrometer provides some great ways to do that (with the DSL syntax or annotations). With the plugin implementation, we wanted to make that extra easy from the context of any function.
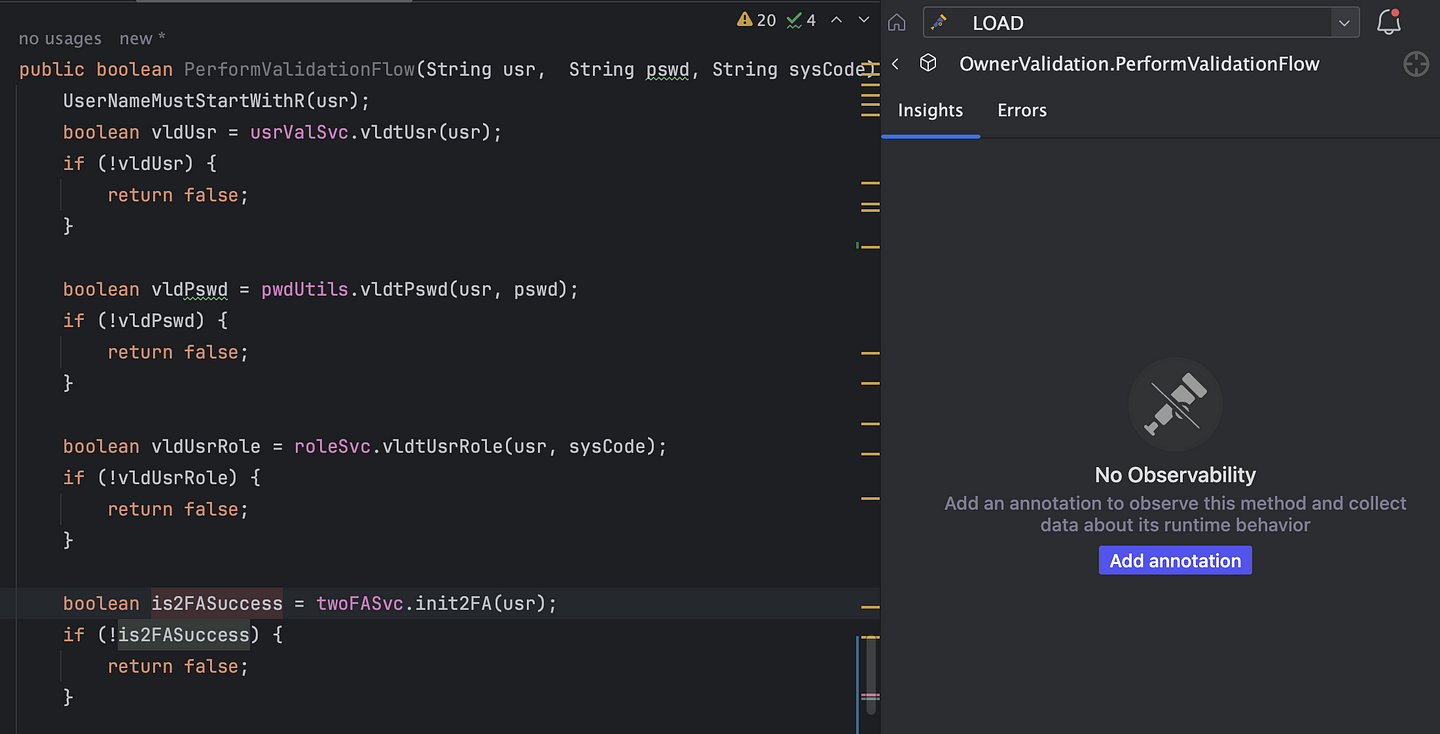
Clicking the button will take care of adding the Observe annotation to start recording useful information about the function invocations. In this manner, we can gradually evolve the project observability coverage from the extremities of the API and clients to the care of the domain logic.
Things to consider when running in production
At some point, it would make sense to start gathering observability data not just from your own machine, or the testing environments, but from the real source of truth — production. Due to its minimal footprint and the fact that it avoids using reflection, Micrometer Tracing performs great in prod. However, there are still some things to consider when observing real-world, high-load environments.
Sampling
Your application in production can generate a very large number of spans (depending on traffic and instrumentation). To reduce the network traffic and the volume of stored data, tracing solutions usually support sampling. Those spans that are “sampled” will be sent to your tracing backend and the spans that are not “sampled” won’t be. There are two main types of sampling: client-side/head sampling when spans are sampled by your tracing library (your application) or server-side/tail sampling when spans are sampled by your backend/ collector/proxy. Spring Boot applications using Micrometer Tracing use client-side sampling with 10% sampling rate by default. You can change this behavior using the management.tracing.sampling.probability property, e.g.: set it to 0.01 if you want to keep 1% of your traces or set it to 1.0 if you want to keep all of them in case you have very light traffic or you are doing server-side sampling.
High Cardinality
If you are collecting metrics, you may run into a cardinality problem in production (depending on your traffic patterns). High cardinality means that one of your metrics has a dimension that can have many (possibly infinite) possible values. For example, if you’re keeping a metric for variables such as email addresses or user IDs that are different for every user, even a request identifier that is unique for every request your application receives. You can end up with millions (or billions) of time series data points simply because one of the dimensions of your metric can have millions (or billions) of values. High cardinality can increase your observability data to unmanageable proportions. It basically means infinite data stored in your application or metrics backend. Infinite data will cause problems since you cannot store an endless amount of data in non-infinite space, it’s only a question of whether your application (memory constraint) or your metrics backend (memory and disk constraint) will break first.
Please be aware of the cardinality of the dimensions you use and always consider user input as high cardinality data (normalize it). You can never know if the user has a random generator handy just to bring your app down. If you need to record high cardinality data, instead of trying to attach this data to your metrics, try to use a different output that was designed to handle high cardinality data, e.g.: logging, distributed tracing, event store, etc. Also, here’s an article about high cardinality if you want to learn more: https://develotters.com/posts/high-cardinality/
Tell us what observability reveals for you

Observability is an important part of the development cycle in dev, test, and production. It can help bring to light important aspects of your application behavior, highlight issues, and even help improve your code. As you activate observability on your Spring up you may find surprising results. Let us know what observability uncovers in your code and whether having continuous access to this data indeed transformed the way in which you write code!
Learn how Digma works: Here


