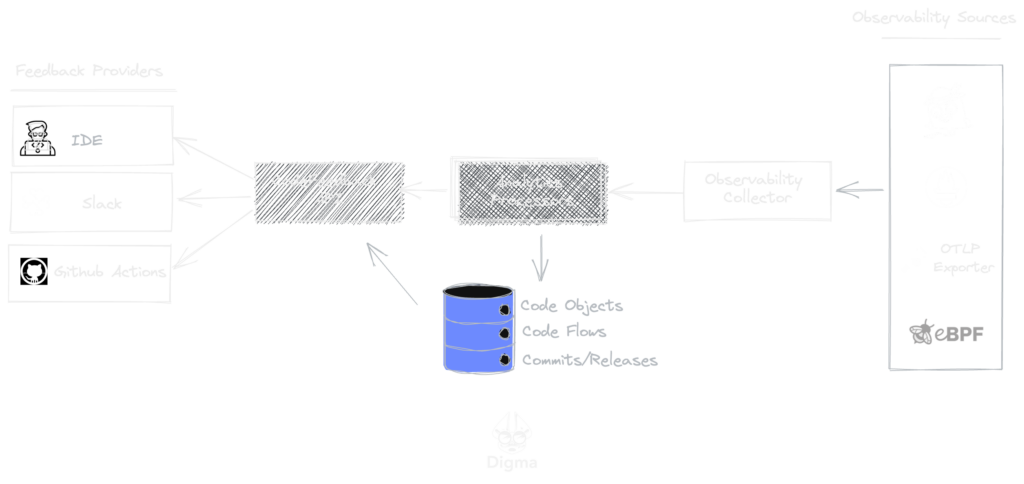
How Digma Works
Unlike traditional observability tools that target DevOps and IT teams, we built Digma as a Continuous Feedback platform for developers that is all about writing performant code.
An IDE Plugin
Digma installs as a standalone IDE marketplace plugin. Running in the development environment.
All data stays local
Digma is not a cloud service and runs either on your laptop or in the safety of your private cloud.
No code changes required
Digma does not require changing your code and has no observability prerequisites. It is also OTEL-compliant!

Turns Observability Data Into Insights
Digma uses OpenTelemetry behind the scenes to collect data (traces, logs, and metrics) about your code when you run it locally. You can also easily forward test and production data to Digma.
After collecting the data, Digma analyzes it to detect meaningful insights about the code. It looks for regressions, anomalies, code smells, or other patterns that can be useful to know about the code and use in development. Effectively, Digma shortens the feedback cycle for developers.
Continuous Feedback Pipeline


