In a previous post, I explained why I think we should care about Continuous Feedback and why it’s the one element of the DevOps eco-system that somehow never got developed. Today, I want to discuss the feedback we currently use in our code and how to make it better.
For anyone not familiar with the concept, “breaking the fourth wall” is that moment when the actor suddenly turns to the audience and winks, acknowledges their presence, or even addresses them directly. It is a small violation of an unwritten contract between the actor and the audience. After all, the type of communication we expected was purely one-way.
The two realities, the fictional one and the hopefully real one we inhabit aren’t supposed to collide. Merely acknowledging the viewer’s existence is a kind of meta-play on that fact, but it can also be a great narrative tool for the screenplay.

Why am I spending so much time describing characters and narratives in an article intended for developers? Our code enacts scripted instructions in production. Observability is how we play the audience that follows the runtime drama unfold. If we can improve that communication we can create better systems, that are easier to maintain and evolve. [I actually happen to see a lot of other useful parallels between writing and code, but that might be the topic for a different post.]
So how is any of this different from what we’re doing today? Surely we have traces and logs that can be used to provide information on what’s going on in our test and production environments. We even have platforms that can sift through these logs and identify trends over huge amounts of data. Does that not provide developers insights about what’s going on? Is the fourth wall already broken?
Well, no. At least that is my opinion. I feel we are lacking three elements to make our communication with our runtime effective: intent, context, and reactivity. My goal in this post is to provide an opinionated alternative approach and platform fundamentals. I feel we need to update our assumptions now that we’re not just writing messages to files as logs have been doing in that past decades. Bear in mind that these ideas are still being formulated, so please take everything with a grain of salt, no matter how decisively it is phrased 🙂

logger.error(‘here2″)
I ran into this specific line recently, but have seen variations of this pattern hundreds of times. The ‘we are here’ log type is used when logs become internal traces for functions. It is the artifact of some debugging attempts or pre-emptive placement of sign-post messages. It can be quite legitimate at times but often abused, opportunistically added, and rarely consistent.
There are two issues with logger.error('we are here doing that'). The first is the lack of context, I’ll expand on that later in this post. The other issue runs deeper and is related to something fundamentally missed in our logging approach: intent. To clarify, we can ask the question: why did the author of the log message decide to classify this message as an ‘error’?
The answer is of course — so it shows up in the logs! ‘Error’ or ‘fatal’ just happens to usually be the highest level of severity/verbosity you can use. This is a way to make your log stand out or avoid being filtered. That answer leads to a bigger problem, one that began four decades ago.
TRACE | DEBUG | INFO | WARN | ERROR
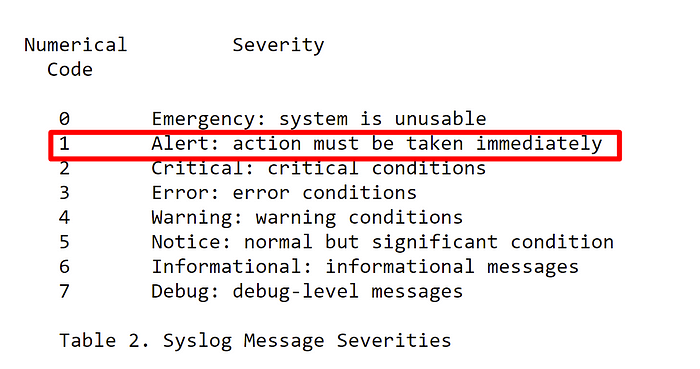
The old Syslog format, invented in the 80s introduced the basic ‘severity’ levels we know today. Interestingly, that original version also had an ‘EMERGENCY’ severity and some other finicky levels that have since faded from usage. The problem with this format is that today it wrongly couples together two different concerns — verbosity and severity. We even have a suspiciously ambiguous term for it — LogLevel.
Consider: Is everything important an ‘error’? Do we really need to classify a line as an ‘error’ just to get it noticed? What do we expect to happen if we do discover something significant enough to be an ‘error’ or ‘warning’? Should it only be a line in the log for someone to check out at a later date? Whichever method we choose, the intent behind the log gets lost in translation.
The original Syslog format actually had an ‘alert’ severity level defined as: “Action must be taken immediately”:

What happens if the log describes an event that does require ‘immediate action’, how do I go about it? I might be tempted to leverage the log severity, but as we saw it is really verbosity in disguise. If that is not enough, logs tend to become messy and polluted with leftover traces and platform messages. I have yet to visit an Engineering organization where a new entry of an ‘error’ level will cause a stir. If I wanted immediate action, logs would not get me there.
Inversion of Observability
Let’s forget the terms logs and traces for a second, and think about the opportunity these specific lines of code present us with. Here is a part of the execution workflow, with full access to its variables and state, just waiting for some camera time. We have that ten-second slot in which the actor directs their gaze at the audience and makes a piercing observation about the situation, how could we make the best use of them?

The key is what I alluded to in the previous example: intent. What are we trying to accomplish? How do we want the information in our hands to be handled?
I would like to suggest three useful verbs or functions that address different possible intents. These are offered as a direct replacement to the TRACE | INFO | WARN | ERROR severities. Each of these new verbs or functions will have different parameters, functionality, and expectations. I hope you’ll agree with me after reading through the example that this would provide real value.
For this, as well as the next examples, we’ll need a placeholder object to operate on and invoke those functions. Since ‘logger’ isn’t up to the task anymore, we’ll use a made-up object to operate on in the sample code. For now, let’s call it ‘cog’, short for ‘cognizance’. The interfaces are all mocked and are there to convey the approach and benefit.
note()
We start with the forensics use case. The goal is to capture information not because there is anything significant about it, but because it might be relevant if we do find an issue. We are depositing an excavation artifact for a future debugging session, so to speak. Severity is irrelevant. Since all we want to do is note facts and data, the interface becomes much cleaner:

There are a few things that stand out. First, where did verbosity disappear to? What’s with ‘persistence’? To fully answer that we’ll need to give some more spoilers about the role of our container object and what it allows us to achieve. Please hold on to those questions just a little longer until we discuss the rest of the verbs.
I do want to point out the significance of decoupling the ‘message’ from any context or artifacts we want to keep as evidence. Since we are no longer treating this as a log in the traditional sense, we can think of a data structure that is more modern than lines of text that will be rendered to file. From an analytics perspective, this will later allow us to normalize some of these parameters and compare different notes more easily, even if they are not standardized, or if we decided to change the message text.
Information nuggets are important, but where they really serve us is in the investigation of some other concern. Enter our second verb. Observe.

The observe use-case is about having data we are unsure about but merits continued observation and follow-up. When I was reviewing logs in different public repositories as research for this post, these were most of the use-cases I encountered. It could be an internal error that is being handled, some expected or low impact exception, or just a situation we didn’t anticipate.

Notice how we decoupled saving any notes and artifacts from noticing a behavior we need to track. By doing that, we can solve a big problem with logging today. Most forensic logs are completely uninteresting until they are. That is, it is an exception or interesting event much further down the execution path that can make all of the information gathered so far suddenly important.
Using this approach, we can save all of the notes in our cognizant context and decide whether to persist it only if something interesting occurred! There is more to it of course. But let’s first conclude our vocabulary. Ready for the next and final verb?

There are those specific locations in the code where you know that if such and such had occurred —it’s time to worry. Data inconsistencies with financial impact, security issues, critical flows compromised and various other scenarios, the stuff of developer nightmares. The alarm verb integrates into the observability/monitoring solutions. It will actually engage the systems that draw people’s attention, depending on severity.

Here as well, since we have been keeping track of all of the forensics in the particular Span (if we’re using OpenTelemetry). That new data structure would be much more fitting to capture application-level analytics as it combines metrics logs and telemetrics as well as linkage to artifacts and can already cluster similar datasets and show which flows are impacted vs. not. We’ll be able to automatically compare and see what makes the spans that fail similar or different from those that succeed.

Into a reactive observability platform
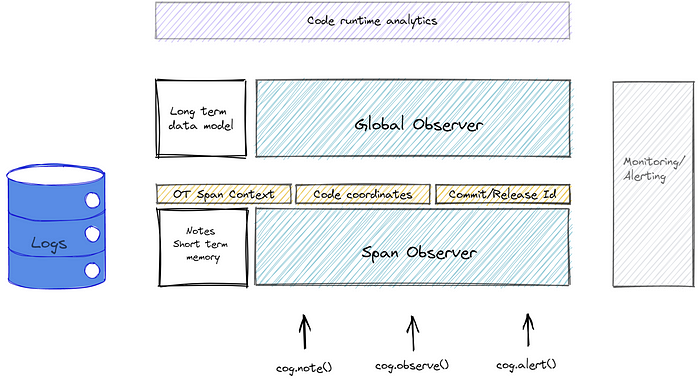
Yes, that escalated rather quickly… Though I wanted to present this new architecture more gradually, there is no choice now but to drop the curtains at this stage and introduce the concept beyond this ‘cognizance’ engine. This is the backend that will make the intent-based prod to dev communication possible. Here is a napkin diagram, no need to get too deep into it, but I will use it to clarify the scope of what I’m suggesting:

Essentially, the end result will be a platform that can handle the continuous forensics data intake and behavior observations, provide context over it, and continue to track and learn from the provided examples, communicating back as we described. The output will not be log lines in a file or a database (although logs will still be forwarded to the logging system), but an analytics data model that can map straight back into the IDE or be accessible via its own dashboards.
Looking beyond the scope of a specific OT span, the long-term data model will allow us to answer questions such as: Is anything different in the frequency of the exception? Has anything changed in the stack trace and flows that lead up to it? Is there a new impact to the end-user in performance or errors? Which spans are exhibiting this error and how are they similar in source, data, or circumstance? This data model can be used to create trends, alerts and correlate to context such as commit identifier or concurrency metrics.

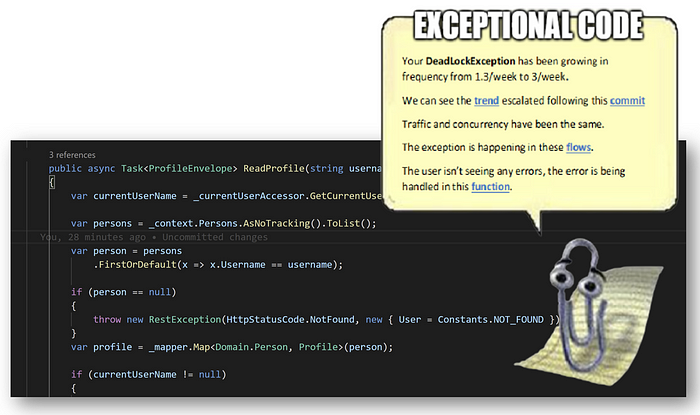
Above is a conceptualization (and dramatization) of the type of information we can use back in the code in ordr to see information in context and apply useful analytics while designing our software. Furthermore, since we are essentially communicating with a stateful system we can communicate back to influence the observations with instructions such as ‘add to my watch lists’, ‘create and track issue’ (associating all relevant information), or even ‘add escalation condition‘.
Summary
A while back I was introduced to ‘reactive collections’, most recently looking at this project. Notoriously difficult to debug and troubleshoot, reactive collections are incredibly powerful. They invert the flow of control so that instead of iterating over the collection from the outside in, we can add layers of functionality in an event-driven fashion, all the way from the source.
Architecturally, it is similar to the change of approach between analyzing observability data from the outside in, as existing tools do, and creating observations and observers processing the data and emitting events to the outside. From a platform perspective, it also provides us with superior data to work on as our observers exist in the code when the problem occurs, instead of trying to reconstruct the event from messages and logs.
Finally, there is an opportunity here. Between unstructured logs, trace data, infrastructure, data metrics, and user analytics, we can start to think about what could be a future data model to store that information in an efficient and queryable way. A live and open data structure format that is far superior to strings in a file and can represent a stateful application with two-way communication between the consumer and the code.
If any of this seems out there, it probably still is… I have begun to recruit the team that will drive some of these open-source initiatives and hopefully, we’ll have more real code to talk about soon. As always, if you’re interested in becoming a part of it, my email is roni.dover@gmail.com or @doppleware on Twitter. Would love to hear your thoughts!
Edit 4/13: I was able to start an open-source project around some of these thoughts with a small team. Check it out here!
An epilogue about context
There is one more topic that I wanted to discuss regarding logging and observability. The need for context.
Consider the ‘we are here doing that’ message we discussed: Where is ‘here’? The simplest type of context we need is the ability to orient ourselves in the code. Amazingly, it is not trivial. Sure, some logs will add the class or method name, but what about the commit identifier or version? How is it possible to follow the log trace if we don’t have the key to placing that log in the context in which it was written?

The next level of context is the overall flow this log belongs to. What request flow is this log file a part of? It makes sense to include the span context, for example, if using OpenTelemetry. With proper instrumentation, that can help us place the log in the overall scope of the operation being carried out.
Finally, we need to have some context about what we are investigating. What prompted us to look into this piece of information and how are they related? Is it a security issue? A performance issue? An elusive bug? How is the particular data from this span different or similar to other data pieces we have collected?
Information without context slows us down and makes it very hard to have a meaningful conversation. Unfortunately, logging frameworks today do not instrument in a way that makes collecting it easy. It can be done, but it is always custom work that needs to be prioritized over other urgent tasks. It is more often than not that I see logs missing these crucial pieces.
If you have stuck by this long, you definitely should become a part of this project 🙂 Thank you for taking in all of these ideas. In the meantime, Keep Calm and…


