Like tests, developer observability tools provide a way for developers to validate code assumptions, without the added cement.

This is the first in a three-part series that will review some of the developer observability technologies available to developers today and what specific insights they can provide. Read part 2 here.
Observability? Isn’t that a DevOps thing?
Historically, observability was never high on developer teams’ worry lists. Coding features is what developers do, and observability doesn’t sound much like code at all (I have written previously about the ‘new feature bias’ and why feedback is critical to dev teams). In fact, in many organizations, it has become common practice to consider observability the sole purview of the Ops and DevOps organizations.
To be fair, ‘Observability’ is an extremely muddled field. It encompasses strangely overlapping sub-genres such as monitoring, tracing, logging, profiling, and APMs. Confusingly, observability tools blend together data collected from different layers of the deployed application stack. Networking and IT-related metrics, service level data, storage, and yes, also application-level tracing and logs. If most of that still sounds like ‘infrastructure’ or ‘IT’, it’s just because historically, that’s just what it was.
As for myself, in the past, I was similarly happy to have other teams take this specific monkey off my back and focus on more attractive feature-building tasks. Understanding how code behaves in the wild has only occurred to me when things went horribly south. Profiling tools were the last resort, really. An unattractive last wrench in the toolbox, to wield only when helplessly faced with inexplicable crashes or unreproducible freezes.
Invest in the observability of code as you would in testing
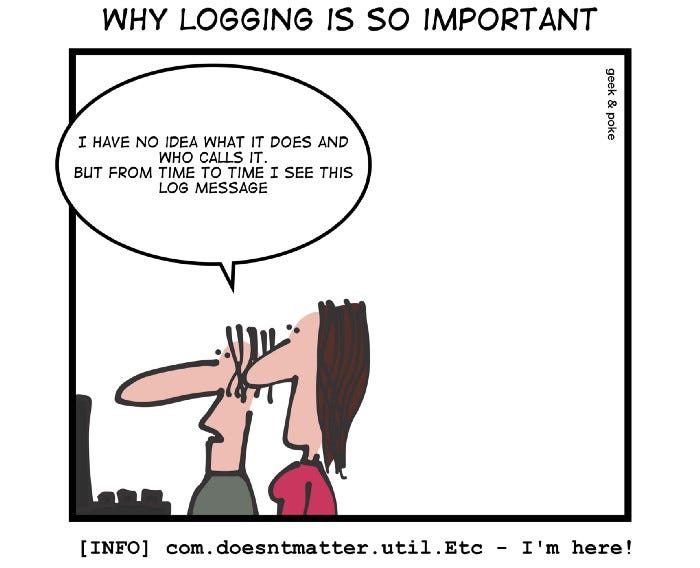
Why do developers need to own their code observability? Because gone are the days that coding was about throwing features over the fence and hoping they fare well in the hands of users and customers. Logging lines of text, the most widely adopted tool to keep track of what the code runtime is doing, can be useful but does not meet the requirements or provide the insights we need for complex software systems.

This reminds me of the early days of testing. Developers had to be convinced that tests are worth their time and effort (not to mention writing them up-front). Better testing frameworks and CI tools, along with a more complete view of the Definition of Done helped get the industry comfortable with the added overhead and time investment involved in collateral activities such as unit and integration tests.
As something of a skeptic, the main benefit I saw in testing was in being able to validate the hidden assumptions in the code. The more complex the logic, the more grandiose the abstractions, the more it was likely that actual behavior differed from the intended one. Developer observability, when done right, complements tests to help achieve just that.
Measuring and tracking code execution, both in pre-prod and production environments, provides an objective, evidence-based way to prove-out code assumptions: Did my change really improve performance? Is the platform becoming more stable? Are these code blocks handling the types of data load we assumed they’d be able to? Is caching the best way to go in this specific area? Am I optimizing for the right things?
Having the ability to answer such questions based on readily available data without needing to invest time and effort to research it each time can accelerate and transform how we plan and execute code and design changes.
Batteries are included
The developer observability ecosystem is evolving. The emerging tools and technologies are much more accessible to developers and offer tangible, practical benefits. The commercial enterprise solutions and the heavyweight APMs of the old generation you may be familiar with will slowly lose ground to a new breed of open-source platforms, packages, and libraries.
For me, the watershed technology in this context is OpenTelemetry, an open specification that will eventually cover tracing, logging, and metrics (only the tracing spec reached a stable version at this point). OpenTelemetry managed to establish a single open standard almost everyone agrees upon and consequently amassed a support matrix wide enough to reach past the critical adoption point.

By now, there are instrumentation libraries for the majority of programming languages, platforms, and frameworks. Some programming languages, such as .NET, even made OpenTelemetry integrated into their native diagnostics component. To take advantage of it, all you really need to do is turn it on.
You’ll also find that instrumentations are already available for commonly used frameworks such as Kafka, RabbitMQ, MongoDB, Spring Boot, Django, node.js, and more. In fact, going over the packages and libraries you’re currently using in your stack, you’ll most likely be surprised by just how many of them are already covered either via official or unofficial instrumentation.
Enough theory — let’s get practical
I was debating which type of example to include with these posts. However, I was absolutely sure what I did not want to write about — setup. There are numerous tutorials and blog posts that do a great job explaining how to set up developer observability tools and OpenTelemetry in particular. This is not a very interesting topic or one where I have much to contribute. I’ll be sure to include links to the existing guides and tutorials.
What I do want to focus on, however, is how to make observability useful. After setting up a basic stack, how do we get useful insights and measurements to use in the coding day-to-day? What can I glean from a trace visualization like this one?

Final Words: Developer observability
In the next post in the series, we’ll do just that and review how to get useful code insights from code, either when developing (to understand execution and constraints) or in studying pre-prod and production data. We’ll take a look at an example application and see how with a few easy steps we can greatly augment our understanding of the code and ability to validate our changes.
As always, I’m extremely appreciative of any feedback and feel free to send any related questions my way so I can make sure to address them.
Until next time!
Continue to Part 2, where things get interesting!
Want to Connect? Do you have any questions about developer observability? You can reach me on Twitter at @doppleware or here.
Follow my open-source project for continuous feedback at https://github.com/digma-ai/digma


