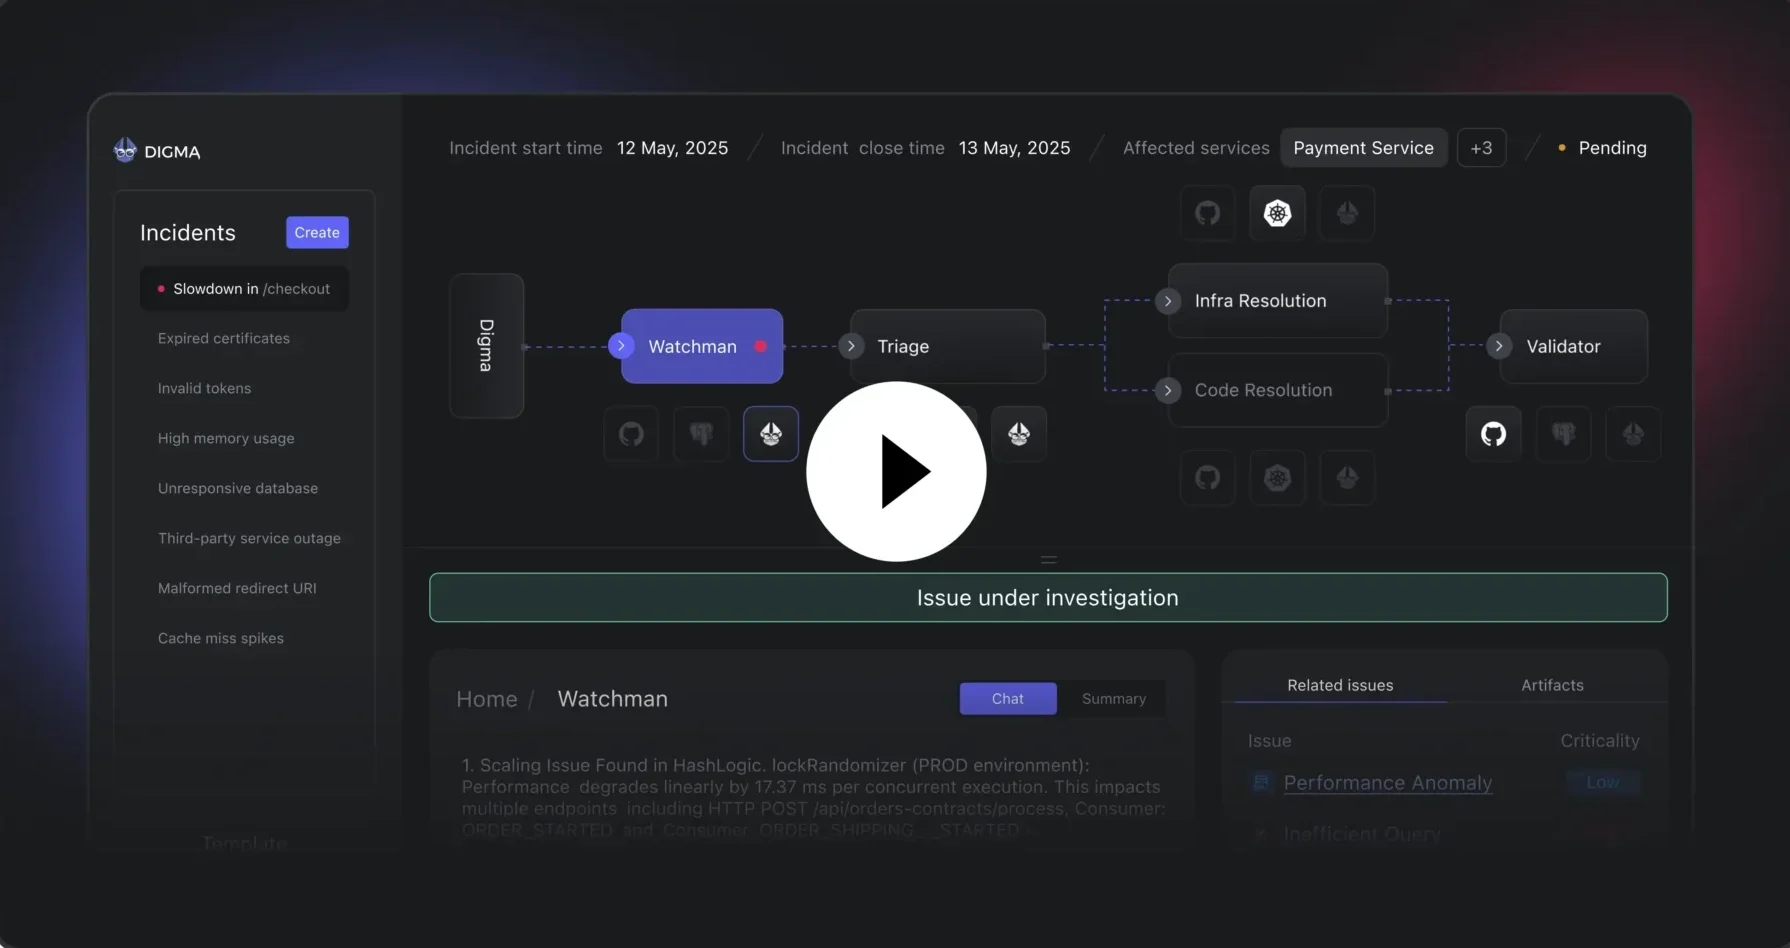
Agentic AI SRE
Autonomous identification, root cause analysis and remediation of code and infrastructure issues
Cut resolution time
by 85%
Digma’s AI SRE pinpoints the root cause, whether in code or infrastructure, and offers precise remediation via pull requests or config updates, eliminating costly investigation cycles and keeping engineers focused on building..
Get accurate, reliable resolutions
Digma’s AI SRE connects to observability stack and key data sources like PostgreSQL, GitHub, and Kubernetes.
This enables precise root cause analysis and trusted fixes, continuously.
Prevent issues
before they break production
Digma’s AI SRE identifies and prioritizes issues based on their real impact, before they escalate. It’s powered by our Dynamic Code Analysis (DCA) engine, built to understand system behavior in real time.
Identify code-level issues with Digma’s Dynamic Code Analysis
Digma’s Dynamic Code Analysis (DCA) engine identifies issues at the code level in pre-production environments, allowing teams to prevent them earlier. The DCA engine processes raw observability data to reveal critical, actionable insights, reducing the effort needed to translate data into practical solutions.
Maximize code review effectiveness
Digma MCP server enhances code reviews by identifying runtime issues in staging and production environments. The agent highlights critical performance problems, uncovering bottlenecks, scaling issues, and slow database queries. The MCP server enables the agent to suggest safe, smart, and production-aware fixes, integrating them directly into the pull request.
Digma’s MCP Server
makes AI Coding smarter
Using a built in MCP Server Digma leverages the data in your APM dashboards to assist the AI agent during code reviews, code and test generation, fix suggestions etc.
Prevent Breaking Changes & Identify Dependencies
Digma MCP server highlights how your code changes impact other services and components during runtime to prevent breaking changes, allowing developers to assess modifications and anticipate issues before they occur.
Improve App Performance with Digma
Digma MCP server improves app performance by identifying the top runtime issues slowing down the application. The Digma’s Dynamic Code Analysis engine analyzes the runtime data, identifies inefficiencies and suggests fixes for the most impactful problems. In the video, it finds database and API endpoint bottlenecks and automatically generates fixes like DB caching and improved scalability.


